Home > Zurich dispatching center > Tools > Time-distance diagram
The time-distance diagram
The time-distance diagram shows the past and projected future movements of trains as lines on a graph. On such a diagram, the horizontal axis is space - specifically, a particular section of line - and the vertical axis is time.
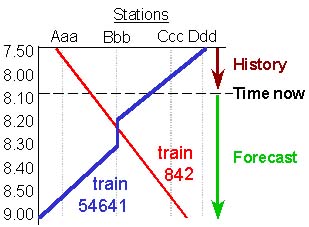
As this highly-simplified diagram shows, trains are presented in either of two colors: trains carrying passengers appear in red, and other trains (including empty passenger equipment) in blue.
Here is an example of the real time-distance diagram, as the Zurich dispatcher sees it:
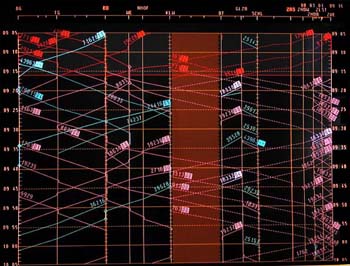
(Click on image for a larger
version and more details.)
The time-distance display shows how the train has been moving and its forecasted further progress. The time-distance display thus lets the dispatcher see emerging conflicts between trains. Although less detailed than the track-diagram display, the time-distance display overcomes a major limitation of the track-diagram display, which is that you cannot see how long a train will require to traverse each section of track.
On the time-distance display, the "current-time" indicator, a red line, updates (moves downward) every five minutes. When it does, it updates the movement lines of all trains to reflect their real progress over the previous five minutes.
Green band
Another feature of the time-distance diagram is the green band, which shows how late - or early - a train can run without conflicting with other trains or missing connections.
Display of more than two tracks
A time-distance diagram shows the traffic on only two tracks at once. In a section with more tracks, such as Dietikon-Altstetten, the dispatcher can call up a separate track diagram for each additional pair of tracks and display all the diagrams side-by-side on the screen.
Trains running the "wrong way"
The paths of trains running the "wrong way" on a track signaled for both directions are shown with a dotted line. In Switzerland, this is usually the right-hand track, as trains normally run on the left. (An exception is the right-hand configuration of the express tracks from Zurich main station to the new flyover between Dietikon and Killwangen.)
Display of out-of-service tracks
The time-distance display shows stations with a thick vertical bar when one or more tracks are out of service. This was the case in Baden, for example, in 1998-2001 during the rebuilding of the station and its track layout. (The system SYFA, which contains the underlying data, can explicitly take into account a track between stations that is out of service, but not an out-of-service station track.)
A number of factors can contribute to the need to manually adjust a train's forecasted run on the time-distance diagram. The accuracy of such forecasts will have to improve in the future, when signaling systems based on moving blocks are introduced.
This site was originally assembled in March 2001. Comments are welcome.
Copyright © 2001-2005 George B. Raymond, Jr. Disclaimer